The Problem:
I worked for a hedge fund that managed around $20 million,
which they invested into stocks and bonds.
This hedge fund insisted that Morningstar and Bloomberg had too many
errors in their financial data. Therefore,
the hedge fund required analysts to manually input the financial statement
data. The manual input process could take 3-5 hours for any particular company,
and the manual input often had errors as well.
For promising investment opportunities, the hedge fund would
analyze comparable investments to ensure the subject company was superior to
peers. This process required the input
of additional data for the comparison companies. The hedge fund often looked for the same desirable
performance indicators from the financial data. The repetitive nature of this work makes it a
prime candidate for automation.
The Solution:
 The goal was to create a tool that takes the ticker entered,
finds relevant comparable companies, and downloads all the financial data for
those companies. The tool then ranks those
companies in comparison to each other—this allows the user to ‘walk above’
hundreds of ratios for each company and quickly make decisions.
The goal was to create a tool that takes the ticker entered,
finds relevant comparable companies, and downloads all the financial data for
those companies. The tool then ranks those
companies in comparison to each other—this allows the user to ‘walk above’
hundreds of ratios for each company and quickly make decisions.
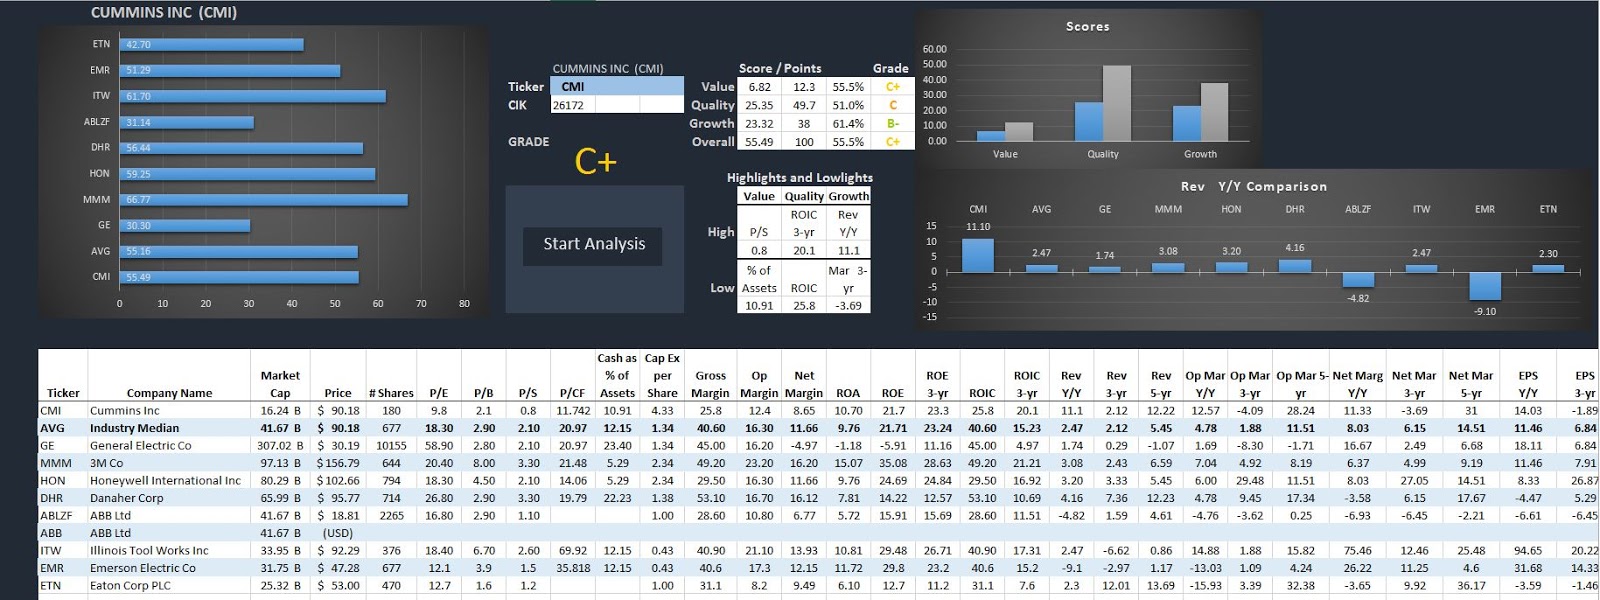
The program I created is called Stock Skywalk. The program downloads financial data from
Morningstar and the SEC website. The program
creates a normal distribution of similar companies, and ranks them compared to
each other. The data is then displayed
using graphs and a familiar grading system that allows users to visually see
the end results after barely one minute.
Stock Skywalk uses Morningstar to select 5-20 comparable
companies for the ticker entered. Each company is ranked based on 27 ratios. The program creates a normal
distribution based on the sample of companies, and ranks each company on each
metric. The individual metric scores are
then combined for a total score for each company.
Files:
No comments:
Post a Comment